We have used DolphinScheduler as our schedule framework for a long time. But we always monitor some repeated scheduling questions. This blog records the whole process for resolve this issue.
Note: We use DolphinSchuduler 3.1.1 version.
We use Tidb for our database, version 6.5.0. The isolation level is default RR (Read Committed).
Quartz with version 2.3.2, storage with JDBC, Using CronTrigger, enable org.quartz.jobStore.acquireTriggersWithinLock=true
Conclusion first. With RR isolation level, Tidb and Mysql, when opening a transaction, create a Read view on different moments, As a result, Tidb will have the problem of Quartz repeated scheduling.
1、Problem happens
Customers reported to us some repeated scheduling problem some time ago.
See below. The job with the same name and same scheduling be run twice, id differ by 1. And it’s not a one time thing. It will occur every one or two days. As a schedule framework, it’s none acceptable for repeated scheduling problems.

2、Identify the problem
First step is identify the problem. The base schedule framwork on DolphinScheduler is Quartz. The first move is identify the reason of this problem, Is it from Quartz or DolphinScheduler. Through troubleshooting logs , we can see it’s from Quartz.

This’s clear. Quartz has repeated scheduling, I felt strange at the time, the reason why is this framwork has long history and stable. Last release is in Oct 24, 2019. A lot of scheduling framework is base on Quartz, like XXL-Job, etc. But we can see it’s very clear that Quartz tigger a same job twice.
There are lot of solution on the internet to fix repeated scheduling is using lock.
Set org.quartz.jobStore.acquireTriggersWithinLock=true
But DolphinScheduler default set this param in config file.
It’s hard to track, it’s not easy to find out. There is not a lot of information on the internet.
I thought it was the database’s question. Like lock is invalid, different threads got the same lock, to be honest, I think this is unlikely. But I have no other idea.
So begin with the source code and scheduling logic about Quartz, a question like this always needs more base knowledge that can be resolved. I saw this blog when I see the source code. It’s very clear, has very good reference value. A huge thanks to the author.
Now we explain some base concepts scheduling in Quartz, which will be used later.
- The core logic about scheduling in Quartz almost is table QRTZ_TRIGGERS. Quartz call one scheduling one fire. Table QRTZ_TRIGGERS has some core columns. TRIGGER_NAME、PREV_FIRE_TIME、NEXT_FIRE_TIME(、TRIGGER_STATE.
- QRTZ_FIRED_TRIGGERS, This table storge the running scheduling jobs information.
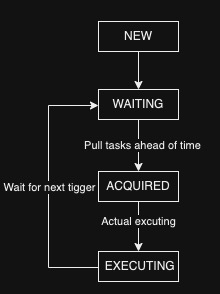
The Tigger status change flow in normally:

Quartz scheduling process simplified:
- Lock.
- Get the trigger list that will be fired, There is a concept here. If now is 9.59, he may get the triggers whose next scheduling time is between 9.57-10.02 to prevent miss scheduling.
- Update QRTZ_TRIGGERS’s status from WAITING->ACQUAIRED.
- Insert trigger information in table QRTZ_FIRED_TRIGGERS with status ACQUAIRED.
- Release lock.
Wait until scheduling actually starts.
- Lock
- Check QRTZ_TRIGGERS’s status is ACQUAIRED or not.
- If yes, change QRTZ_FIRED_TRIGGERS status to EXECUTING
- Upate QRTZ_TRIGGERS’s next_fire_time
- Update QRTZ_TRIGGERS’s status to WAITING
- Release lock.
1、Enable MVCC Log
While reading the source code, We touch DBA if they can record all sql in database for troubleshooting.
DBA told us that recording all sql will cost logs of disk storge. But they can enable MVCC log first. Means we can switch different moment to see the status in the database, It’s also useful.

After investigation you can see, for one scheduling fire, QRTZ_FIRED_TRIGGERS has two records. More confirmed the repeated scheduling is caused by Quartz.
But we can’t see the detailed sql run, It’s not very valuable just see the MVCC log.
2、Enable full logs
After touching DBA, they deployed a new database cluster just for us test which can enable full logs.
It’s more easier if we have full logs.
1 | [2024/02/28 18:45:20.141 +00:00] [INFO] [session.go:3749] [GENERAL_LOG] [conn=2452605821289251623] [user=udp@10.249.34.78] [schemaVersion=421] [txnStartTS=448042348020498438] [forUpdateTS=448042348020498438] [isReadConsistency=false] [currentDB=udp] [isPessimistic=true] [sessionTxnMode=PESSIMISTIC] [sql="INSERT INTO t_ds_process_instance ( process_definition_code, process_definition_version, state, state_history, recovery, start_time, run_times, name, host, command_type, command_param, task_depend_type, max_try_times, failure_strategy, warning_type, warning_group_id, schedule_time, command_start_time, executor_id, is_sub_process, history_cmd, process_instance_priority, worker_group, environment_code, timeout, tenant_id, next_process_instance_id, dry_run, restart_time ) VALUES ( 12316168402080, 1, 1, '[{\"time\":\"2024-02-28 18:45:20\",\"state\":\"RUNNING_EXECUTION\",\"desc\":\"init running\"},{\"time\":\"2024-02-28 18:45:20\",\"state\":\"RUNNING_EXECUTION\",\"desc\":\"start a new process from scheduler\"}]', 0, '2024-02-28 18:45:20.007', 1, 'shell-1-20240228184520007', 'udp-service-dev-aiad-master-1.udp-service-dev-aiad-master-headless.wap-udp-dev.svc.aiadgen-int-1:5678', 6, '{\"schedule_timezone\":\"Asia/Shanghai\"}', 2, 0, 1, 0, 0, '2024-02-28 18:43:08.0', '2024-02-28 18:45:17.0', 810004, 0, 'SCHEDULER', 2, 'default', -1, 0, -1, 0, 0, '2024-02-28 18:45:20.007' )"] |
We can see repeated scheduling happens though logs. Estimated schduling time is 2024-02-28 18:43:08.0
We need to find related logs with scheduling in QRTZ_FIRED_TRIGGERS and QRTZ_TRIGGERS.
The first time scheduling log.
1 | [2024/02/28 18:45:08.250 +00:00] [INFO] [session.go:3749] [GENERAL_LOG] [conn=2452605821289251625] [user=udp@10.249.34.78] [schemaVersion=421] [txnStartTS=448042343682015234] [forUpdateTS=448042344638840833] [isReadConsistency=false] [currentDB=udp] [isPessimistic=true] [sessionTxnMode=PESSIMISTIC] [sql="UPDATE QRTZ_TRIGGERS SET JOB_NAME = 'job_1201640', JOB_GROUP = 'jobgroup_1200004', DESCRIPTION = null, NEXT_FIRE_TIME = 1709145788000, PREV_FIRE_TIME = 1709145784000, TRIGGER_STATE = 'WAITING', TRIGGER_TYPE = 'CRON', START_TIME = 1709114081000, END_TIME = 4861267200000, CALENDAR_NAME = null, MISFIRE_INSTR = 1, PRIORITY = 5 WHERE SCHED_NAME = 'DolphinScheduler' AND TRIGGER_NAME = 'job_1201640' AND TRIGGER_GROUP = 'jobgroup_1200004'"] |
The second time scheduling log.
1 | [2024/02/28 18:45:18.454 +00:00] [INFO] [session.go:3749] [GENERAL_LOG] [conn=2452605821289251605] [user=udp@10.249.34.78] [schemaVersion=421] [txnStartTS=448042345936453636] [forUpdateTS=448042347509317637] [isReadConsistency=false] [currentDB=udp] [isPessimistic=true] [sessionTxnMode=PESSIMISTIC] [sql="SELECT TRIGGER_NAME, TRIGGER_GROUP, NEXT_FIRE_TIME, PRIORITY FROM QRTZ_TRIGGERS WHERE SCHED_NAME = 'DolphinScheduler' AND TRIGGER_STATE = 'WAITING' AND NEXT_FIRE_TIME <= 1709145941638 AND (MISFIRE_INSTR = -1 OR (MISFIRE_INSTR != -1 AND NEXT_FIRE_TIME >= 1709145618319)) ORDER BY NEXT_FIRE_TIME ASC, PRIORITY DESC"] |
It can be seen that the thread relationship is present, after first scheduling is finished, the second scheduling occurs.
A bit confusing it’s after first scheduling finised. Will update the next_fire_time in table QRTZ_TRIGGERS. But second scheduling triggered after select is the same time as the first schedule.
We can’t get the return about the sql executed. But after researching the log, the second scheduling thread got the same result when running select.
Very weird, We thought it was some problem with database’s master-slave synchronization. Resulting second thread got the data is before first thread update.
But we see the database’s status by MVCC.

Ver clearly, when the second thread scheduling, the data in database has been updated. This is no sync question.
And judging from ths log, it’s executed serially. This means the lock is correct, talk about lock, let’s see the process about get and release lock.
3、See the lock logs
We can simply understood conn to thread number. The result is unexpected. The second scheduling thread try to get lock from 45mins 11s, real get lock at 45mins 18s. Wait for 7 seconds.
1 | [2024/02/28 18:45:11.772 +00:00] [INFO] [session.go:3749] [GENERAL_LOG] [conn=2452605821289251605] [user=udp@10.249.34.78] [schemaVersion=421] [txnStartTS=0] [forUpdateTS=0] [isReadConsistency=false] [currentDB=udp] [isPessimistic=true] [sessionTxnMode=PESSIMISTIC] [sql="SELECT * FROM QRTZ_LOCKS WHERE SCHED_NAME = 'DolphinScheduler' AND LOCK_NAME = 'TRIGGER_ACCESS' FOR UPDATE"] |
So when is the first scheduling process got the lock, I sorted it out the timeline about two thread got and released locks.
We call the first scheduling thread simply 625, the second simply call 605.
18:45:09.427 625 Apply for lock
18:45:11.772 605 Apply for lock -> blocking
18:45:12.210 625 Got the lock
625 Execute scheduling logic
625 18:45:16.730 Finished,uodate table triggers
18:45:17.287 625 Release lock
18:45:17.928 625 Apply for lock
18:45:18.363 605 Get the lock
605 Execute scheduling logic
When I see the log here, I have a guess thinking. When 605 gets the lock and execute the sql got the same result as 625.
4、Reproduction problem
We can reproduce this process.
First create table.
1 | CREATE TABLE `QRTZ_LOCKS` ( |
Then we open two session and test in the following order.
Tidb
| Process1 | Process2 |
|---|---|
| start TRANSACTION; | |
| start TRANSACTION; | |
SELECT * FROM QRTZ_LOCKS WHERE SCHED_NAME = ‘DolphinScheduler’ AND LOCK_NAME = ‘TRIGGER_ACCESS’ FOR UPDATE; Currect read |
|
SELECT * FROM QRTZ_LOCKS WHERE SCHED_NAME = ‘DolphinScheduler’ AND LOCK_NAME = ‘TRIGGER_ACCESS’ FOR UPDATE; Currect read |
|
UPDATE t_ds_version set version = ‘2’ where 1 = 1; |
|
| commit; | |
select * from t_ds_version; Snapshot read |
|
version = 1 |
select * from t_ds_version; in process 2. Get version=1.
And the same sql runs in Mysql, process 2 get version=2.
The reason why is when Mysql and Tidb open a transaction, create Read view at different moments.
Mysql in RR isolation level, the First
Snapshot readin same transaction will create a Read view, the snaptshot after this will read the same read view.
I can’t see some documents about Tidb. But accros the result, TIdb create a Read view when start a transaction. About Mysql’s document you can refer MVCC implementation mechanism of Mysql InnoDB, in Chinese。
That means it is this different that leads to the problem of repeated scheduling.
5、Problem review
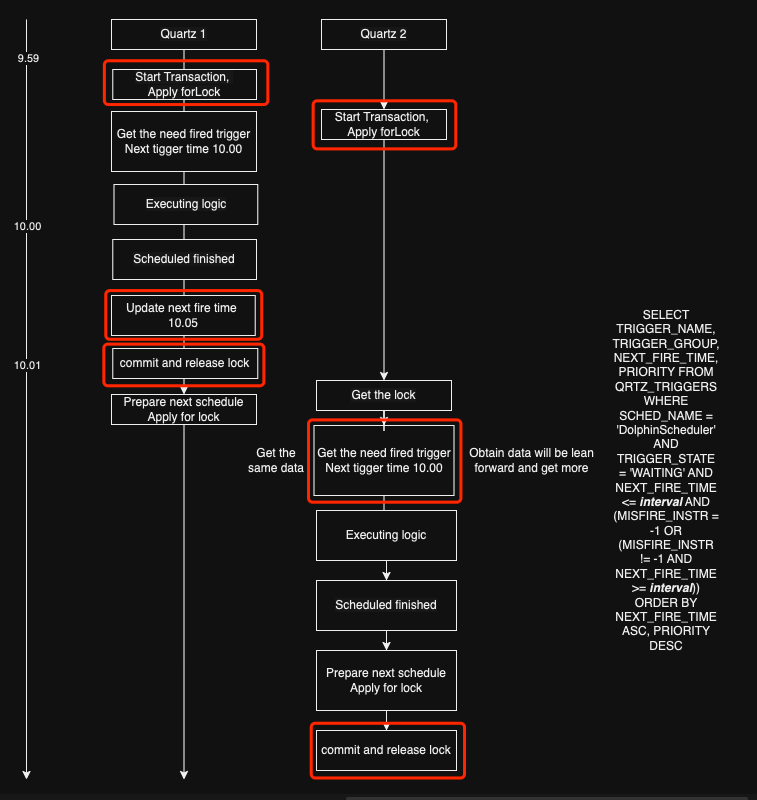
Let’s assume a situation. see the fifure below.

Two services start the transaction one by one, then apply for lock, executing scheduling logic when get the lock.
As shown, will occur repeated scheduling problems. Just see the logic in red box. It’s the same logic we simulate in Tidb and Mysql, service 2 with Tidb database, when get the lock and run select sql, will got the Read view which created on 9.59, so will trigger the job which scheduling time is 10.00. Occur a repeated scheduling. Even run three or four times if under extremely coincidental circumstances.
三、Solution
Change to Mysql database or change isolation level in RC.
About why this is a different in RR isolation between Mysql and Tidb, you can track this.


